/f/92524/1423x870/d094dec825/10.png)
<<Hi, my name is Edwin and I'm a Grasshopper Expert at ShapeDiver. In this 2-part tutorial I will show you the role data trees play inside a Grasshopper model and how it directly translates into faster computation times and other benefits.>>
It is important to be aware of how data flows through parametric models created with Grasshopper. A good data flow will help optimize the computation speed and keep data organized.
With Grasshopper, data can be stored and structured in items, data lists and data trees. Trees can be of great help for performing operations over different sets of data simultaneously without creating copies of the script, as well as keeping relevant information together to avoid unnecessary operations. In some crucial cases, mastering the use of data trees and the interactions between the different data structures will considerably improve the computation speed of your definitions.
In the first part of this tutorial, we start by presenting data structures in Grasshopper and apply data trees to a simple example that demonstrates how useful they can be. If you are already familiar with data trees in Grasshopper, you might want to head straight to part 2, where we look at some useful cases where data trees help simplify and optimize Grasshopper definitions.
Part 1: Introduction To Data Trees In Grasshopper
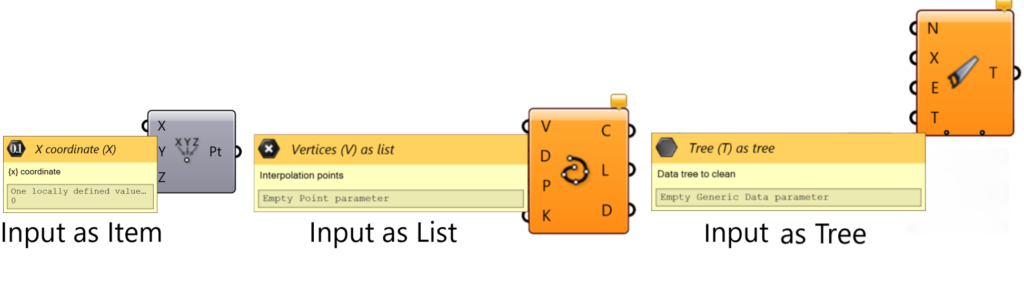
Items and Lists
Before getting into data trees, we need to look into what they are made of. The branches of Grasshopper trees contain instances of the simpler Grasshopper data structures: items and lists.
An item is a single piece of data and is the core of all data structures.
A list is a collection of items.
In Grasshopper, the interaction between an item and a list helps create multiple pieces of data using a single component. For example, the Circle component can generate a circle using a plane and a radius as inputs.

If we input a single plane and a list of radii instead of a single radius, the component will re-use the same plane and create a different circle for each radius in the corresponding list. The result is a list of circles which preserves the order and length of the input list of radii.

Circles with four different radiuses (5, 3, 6, 8) in the same XY plane in the origin.
Now If we provide both a list of planes and a corresponding list of radii to the component, it behaves in a different way. In this case, the component matches items of both lists two-by-two, according to their index in the list. The first plane is matched with the first radius, the second plane with the second radius, etc.

Circles with four different radiuses (5, 3, 6, 8) in XY planes with four different origins in the Z axis (0, 2, 4, 6).
In case the lists don’t contain the same number of items, the last item of the shortest list is used several times to match the longest list. In the example below, the last radius (8) is re-used for all planes with indices 3 and above.

Circles with four different radiuses (5, 3, 6, 8) in XY planes with seven different origins,
three extra planes, in the Z axis (0, 2, 4, 6, 8, 10, 12).
With this very minimal script, we have already managed to generate the base circles for a parametric cup.
Note that most components in Grasshopper will behave according to these rules, but there are exceptions. The Circle component expects two items as inputs, but some components expect a list from the start, in which case the list itself will be treated as a single item. For example, the Interpolate component takes a list of points as input, but will of course create only one curve joining them.
However, most components will expect items as inputs, unless they have a very good reason not to. You can always check whether the component expects a list by hovering over its inputs.
What Is A Data Tree?
Now that we know about items and lists, we can review what a data tree is and how it organizes the previous data structures. A data tree is a hierarchical structure that stores and organizes items and lists through addresses or paths. These paths are defined by integers which group data in different levels. A one level tree has paths with single integers which are the origin of the branches.
The simplest example to generate a tree is the division of a curve. If a curve is divided, a list of points is generated. However if a list of curves is divided, several lists of points are generated which need to be distinguished in reference to each input curve. In this case, a data tree is created where each path corresponds to one item in the list of original curves.

Seven circles get divided 24 times. The result is a tree with seven branches with 24 items/points each.
What Can Be Done With Data Trees?
When there is data organized in trees, the structure of the paths can be influenced to reorganize or clean the content. The most common operations are to simplify, flatten or graft. If a tree is simplified, the indices of the tree which don’t contain relevant information get removed. Flattening a tree means to merge all of its data in a single list. Finally, grafting a tree is the most intricate operation. When grafting, each branch of the tree gets further separated in smaller branches, corresponding to the number of items contained in the branch.

As these are very common operations in Grasshopper, they can be quickly accessed in all the outputs of any component when right clicking.

Another useful operation is to flip a tree which means to swap rows and columns in the structure.

24 points in each of the seven horizontal circles were flipped to get seven points that when connected create 24 vertical curves.
If a data tree of points generated by the division of a list of curves gets flipped, then the points in the same index of the original curves can be connected to generate the opposite wireframe. Additionally, if the original curves get gradually rotated, the opposite wireframe could create a twist effect. This shows how versatile and useful data trees can be.

Each original circle was rotated gradually until 120 degrees to get the twist effect.
Check out the final result of this model down below, which has been uploaded to ShapeDiver's platform: